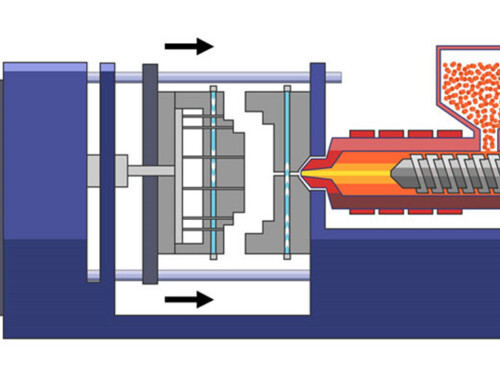
When tooling is scheduled, usually experienced injection molding engineers will not be interested in the image of the mold. The key is to determine if there are any potential molding hazards prior to steel cutting. Engineers can anticipate filling behaviour, cooling time, shrinkage and warpage by using mouldflow analysis, thus minimizing the chances of expensive mould changes in the future. This guide details when a Moldflow analysis should be used, what information the engineer should look for in the simulation, and how the information obtained from the simulation can be used in the design before manufacturing.
1. What Is Moldflow Analysis?
Moldflow analysis uses injection molding simulation software to predict how molten plastic flows inside a mold cavity before tooling is manufactured. Engineers can assess filling performance and determine possible molding risks in a mold based on the 3D part model, material data, gate position, wall thickness, mold temperature, melt temperature, injection speed, and packing parameters before even building the mold.
During our tooling projects, engineers seldom pay attention to the simulation images. The results are only significant if they are used to explain why a molding problem might occur and if they are used to determine ways to prevent the problem from occurring before steel is cut.
In short, Moldflow analysis is used to answer the following questions:
- Can the plastic completely fill the part?
- Where are short shots likely to occur?
- Where will weld lines appear?
- Where are air traps or burn marks likely to form?
- Will the part warp due to uneven shrinkage?
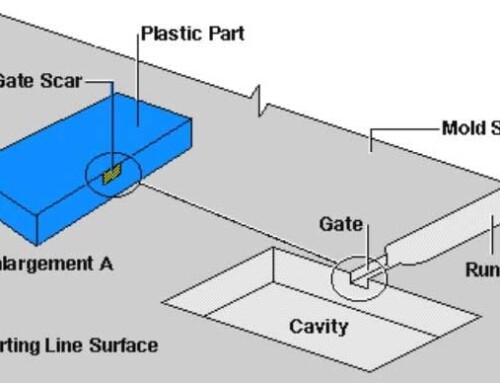
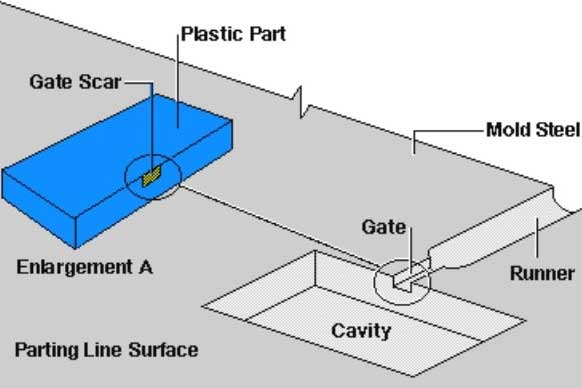
- Is the gate location appropriate?
- Is the cooling system balanced?
- Is the selected material suitable for the current design?
They are typically easy and inexpensive to fix when they are discovered prior to tooling, as opposed to after, when the tooling is already complete. Once the mold is created, however, it is not unusual for some changes to the mold – not just the process – to be necessary. The solution is often the relocation of gates, the alteration of wall thickness, venting, optimizing for cooling, and in many cases, even part redesign.
The true power of Moldflow analysis is to measure the invisible molding behaviour. It measures the cavity pressure and the temperature distribution of the mold; checks the good injection molding practice of gate location and cooling channels; indicates the cause of warpage; calculates the packing transfer point for good molding; and helps reduce the residual stress within an acceptable range. This means that the first time the mold is used it is more likely to have a good chance of success and unneeded mold changes may be prevented.
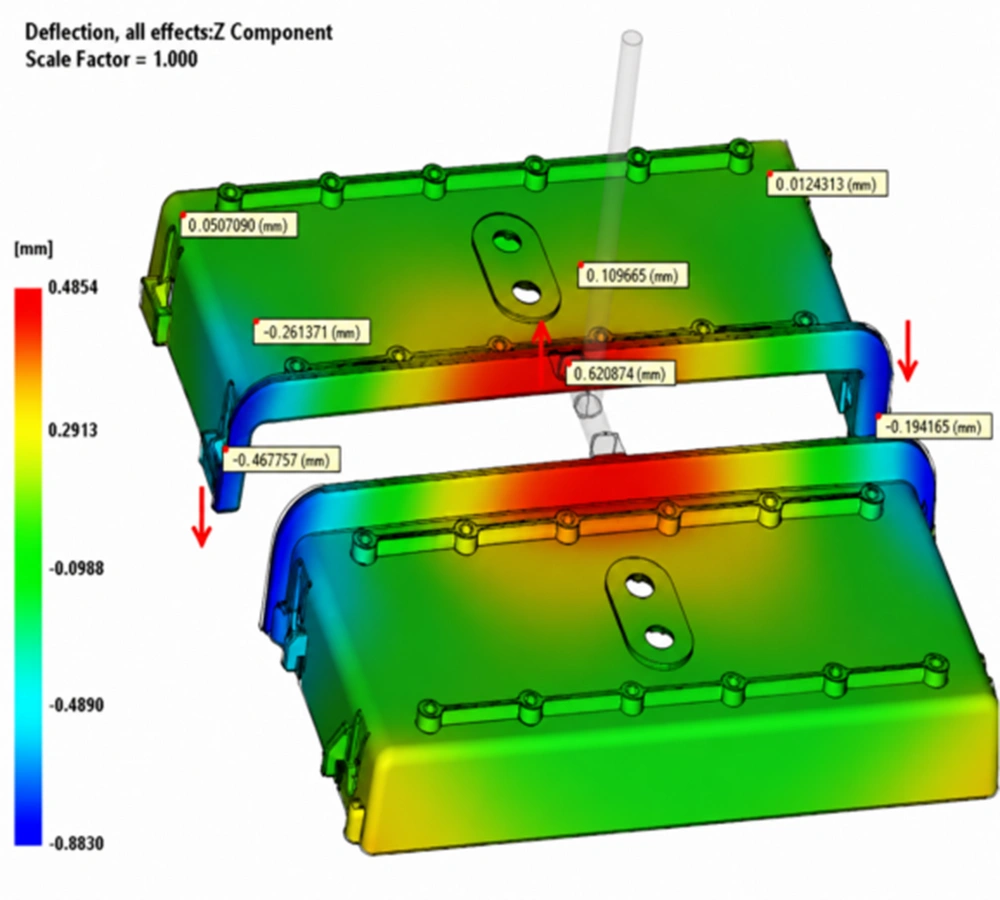
Mold Flow Analysis Illustration
2. Which Parts Require Moldflow Analysis?
All plastic parts do not need to be analyzed with Moldflow. For conventional thick-wall consumer products with relatively uniform wall thickness and flow lengths below 200 mm, experienced DFM engineers can usually evaluate the major molding risks without running a simulation.
Sometimes, however, the requirements for part geometry, material behavior and/or dimensions are increased and engineering experience is insufficient. Moldflow analysis is recommended for the following 7 types of plastic parts, but generally should be done before tooling.
1) Thin-Wall Plastic Parts
Wall thickness ≤ 1.2 mm with a flow length-to-thickness ratio greater than 150:1. Under these conditions, it is not feasible to predict the viscosity of the melt with empirical design rules because of the presence of significant shear heating, a high rate of viscosity change or imbalance in the filling.
2) Large Plastic Housings
Projected area of one cavity ≥ 400cm². Uncontrolled warpage due to non-uniform cooling can be greatly exacerbated by long flow paths and shrinkage differences.
3) Medical Precision Components
Implantable-grade and transparent medical plastic parts are highly sensitive to residual stress. Internal stress may lead to reagent cracking, optical birefringence, or sterilization-induced deformation, making residual stress control a critical requirement.
4) Automotive Plastic Components
Interior and exterior automotive trim parts often require assembly gap tolerances within ±0.3 mm. Even slight warpage can result in poor fit or assembly failure.
5) Multi-Gate Molded Structures
Parts using two or more gates, including valve-gated hot runner systems. When multiple melt fronts meet at different times, high-stress weld lines are likely to form, making simulation the most reliable way to optimize gate layout.
6) Glass-Fiber Reinforced Plastics
PA, PP, or ABS materials reinforced with 10%–60% glass fiber. Fiber orientation follows the melt flow direction, creating significant directional shrinkage differences. In many cases, warpage can be three to six times greater than that of unfilled resins.
7) High-Tolerance Plastic Parts
Plastic parts requiring dimensional tolerances of ±0.05 mm or tighter. Even minor packing pressure variations can cause dimensional drift beyond specification limits.
3. Eight Common Injection Molding Defects Predicted by Moldflow Analysis
A common misunderstanding is that Moldflow analysis is just a way of creating an attractive simulation image in color. In fact, be experienced engineers will pay much less attention to the colors than what the simulation shows. The true challenge is to pinpoint the actual cause of a defect and to devise a way to remove it before tooling starts.
The following are the most common injection molding defects that can be predicted and evaluated through Moldflow analysis.
| Defect Type | Moldflow Prediction & Engineering Criteria |
| Short Shot | Predicts incomplete cavity filling by evaluating melt viscosity increase, end-of-fill pressure, and maximum achievable flow length. It helps determine whether the problem is caused by insufficient injection speed or excessive flow resistance. |
| Weld Line | Identifies weak molecular bonding regions and outputs weld temperature, cavity pressure, and convergence angle. When weld temperature falls more than 25°C below the material melting point, weld strength drops significantly. |
| Air Trap & Burn Mark | Predicts trapped gas locations and cavity gas compression pressure. When cavity pressure exceeds 8 MPa, irreversible carbonization and burn marks may occur. |
| Sink Mark | Predicts localized surface depressions and quantifies sink depth. Areas where the wall thickness exceeds 1.4 times that of adjacent sections are considered high-risk for sink marks. |
| Warpage | Predicts three-dimensional displacement and separates deformation into cooling-induced warpage, volumetric shrinkage warpage, and fiber-orientation warpage while calculating the contribution of each factor. |
| Overpacking | Predicts localized cavity pressure overload and residual tensile stress. When packing pressure exceeds 90% of the material yield strength, cracking or whitening may occur after ejection. |
| Uneven Shrinkage | Predicts volumetric shrinkage variation throughout the part. For precision components, shrinkage variation should generally remain below 0.8%. |
| Poor Gate Layout | Predicts global flow imbalance. A melt front arrival time difference of 0.3 s or greater indicates filling imbalance, which often leads to uneven shrinkage and permanent residual stress. |
In practice, not every predicted defect requires modification. The key is identifying which risks will affect tooling, part quality, or production stability, and addressing those issues before the mold is built.
4. Six Critical Moldflow Results Engineers Must Review
A Moldflow report is only useful if it’s used for the right engineering decisions. Experienced engineers do not just look at individual simulation plots, but instead they look at a few key results that will influence the design of the mold, stability of the molding process, and quality of the parts.
1) Fill Time
It is not always easy to manufacture a part that will fill up. Our focus is more on filling up balance. If the parts are symmetrical, the fill time deviation should not exceed 0.25 s. If the deviation is more than 0.3 s, it means that the packing is not balanced, with one side being overpacked and the other underpacked.
In multi-gate designs, weld lines should be avoided from load carrying features and Class-A cosmetic surfaces. Even for long-flow parts, critical shear rate limits should be considered to prevent shear burning.
2) Injection Pressure
Two values deserve particular attention:
- Maximum injection pressure
- Residual cavity pressure
Injection pressure should be kept at less than 80% of machine’s rated pressure. Beyond this limit, there is a decrease in processing margin and instability in production.
Residual cavity pressure differences greater than 35 MPa can introduce permanent molded-in stress, often leading to delayed warpage during storage or service.
3) Weld Line Location
Where a weld line is placed is important, but so much more is the temperature.
High risk weld line occurs when the melt convergence temp is 25–30°C below the material’s melting temp. In these conditions, polymer chains are not able to diffuse and bond enough to create a good weld.
Moldflow analysis ensures that weld lines do not run into clips, bosses, structure or cosmetic surfaces. Usually, high-risk weld lines need to be moved and do not need extra venting.
4) Air Trap Location
Air traps typically form where multiple melt fronts converge at the end of filling.
They generally fall into two categories:
- Open air traps often can be eliminated by adding proper venting.
- These are called closed air traps and are totally surrounded by molten plastic and cannot be vented out.
One of the main sources of micro-voids and surface burn marks is the formation of compressed gas in the closed air traps, whose temperature can exceed 200°C in many cases above that of the melt.
5) Sink Mark Prediction
A thick section does not necessarily produce a sink mark. What matters is the thickness relationship between adjacent features.
For general design considerations: When the thickness of the root of a rib or boss is more than 1.3 times as thick as the nominal thickness of the wall, visible sink marks are likely to occur.
Moldflow analysis also analyzes the packing efficiency in thick sections.
- Process optimization can frequently be used to improve sink depth ≤ 0.08 mm.
- When the depth of the sink is ≥ 0.15 mm, it is generally not necessary to adjust the machine parameters, but it is necessary to perform structural core-out.
6) Warpage Analysis
Warpage analysis is most beneficial for the majority of engineering projects because it can pinpoint the source of the warpage, NOT just the location of it.
Total warpage is divided into three independent contributors at Moldflow.
- Cooling-induced warpage, which is due to a difference in the mold temperature exceeding 8°C and is typically between 55% of the total to 65% of the deformation.
- Uneven wall thickness and material accumulation at specific locations resulting in volumetric shrinkage warpage.
- The warpage that is peculiar to glass-fiber reinforced materials and cannot be eliminated by process changes.
Finally, customers aren’t so much concerned about the simulation as the next steps. Recommendations for engineering should therefore be clearly expressed in a useful Moldflow report—for example, by moving a side gate to the centre of the part to reduce the maximum flow path. Practical recommendations are the value of Moldflow analysis for real engineering projects.
5. How Moldflow Analysis Optimizes Overall Mold Design
The role of Moldflow analysis is not to provide reports, but to aid in engineering decisions. Finally, each and every simulation result should be translated into a real improvement in mold design, material selection, or process optimization.
1) Gate Location Optimization
The goal is to reduce total flow length and to have a uniform melt flow across the cavity.
For standard ABS materials, the effective flow length of a single gate is typically limited to approximately 220 mm. Large plastic housings often benefit from symmetrical dual-gate configurations to reduce shear stress and improve filling balance.
Gates should never lead directly into rib intersections where this can lead to jetting and layered residual stress.
Moldflow analysis compares multiple gate layouts and identifies the solution with the lowest weld stress and peak injection pressure.
2) Cooling Channel Optimization
The most important indicator is mold surface temperature variation.
If precision plastic parts are required, the temperature variation of the cavity should be kept to no more than 6°C.
In traditional cooling arrangements the formation of thick bosses and ribs can cause local hot spots which can reach up to 12-18°C temperature differences.
The engineers can use moldflow analysis to optimize the conformal cooling channels and baffle cooling systems to ensure that the temperature variation in the hot spot is kept within 5°C and the cooling induced warpage is considerably reduced.
3) Material Selection
Material selection is not simply a comparison of strength or hardness. More importantly, engineers evaluate shrinkage behavior, shear sensitivity, and crystallization characteristics.
Generally good flowability for conventional applications – PP, PE and ABS. Engineering plastics like PC, POM, PA, PBT, and PEEK are more sensitive to temperature, pressure and shrinkage.
For example:
- Homopolymer PP shrinkage: approximately 2.1%
- Copolymer PP shrinkage: approximately 1.2%
- GF30 PA6 shrinkage parallel to flow: approximately 0.9%
- GF30 PA6 shrinkage perpendicular to flow: approximately 2.2%
Moldflow analysis allows engineers to compare warpage performance across different materials and balance dimensional stability with material cost.
4) Cycle Time Reduction
In production, cooling is often the longest stage of the molding cycle. It typically accounts for 60%–70% of the total cycle time, and excessive cooling is one of the most common sources of unnecessary production cost.
Moldflow analysis identifies the safe ejection temperature and eliminates unnecessary cooling time. Combined with optimized cooling channel design and customized packing profiles, cycle time can be reduced by 12%–28% without increasing residual stress in the molded part.
The result is higher daily mold output, lower energy consumption per part, and lower manufacturing cost. For high-volume injection molding projects, even reducing the cycle by a few seconds can generate substantial savings over the life of the program.
6. Case Study
We take the Moldflow analysis of an automotive PP instrument panel trim as an example to introduce the optimization process and results, and provide a summary for reference.
1) Basic Product Information
a. Part Dimensions
138.9 mm × 34.5 mm × 16.6 mm. A long decorative component with an assembly flatness requirement of ≤ 0.25 mm.
b. Material
PP + 10% Talc, melt density 0.905 g/cm³, shrinkage rate parallel/perpendicular to flow direction: 1.1% / 1.8%.
c. Initial Mold Design
Two-cavity mold with a single side gate fed through an ejector-pin gate. Main runner diameter φ8/φ4 mm and a rectangular side gate measuring 8 × 1.5 mm.
d. Mesh Generation
Dual-layer surface mesh with 13,558 elements, a mesh match rate of 92.7%, and an aspect ratio below 6, meeting the required simulation accuracy.
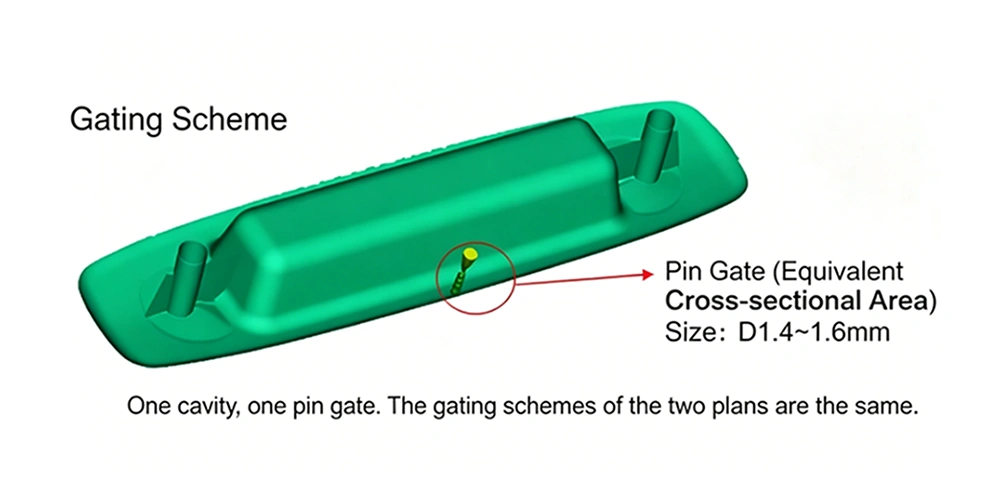
Original Gate Design Layout
2) Initial Filling Simulation Results and Quantified Defect Data
Initial molding parameters:
- Melt Temperature: 255°C
- Mold Temperature: 60°C
- Fill Time: 1.9 s
- Packing Pressure: 47.3 MPa
- Packing Time: 10 s
- Cooling Time: 22 s
a. Fill Time
Complete filling was achieved in 1.988 s, but the melt front at the end of the long part lagged by 0.32 s, indicating significant filling imbalance.
b. Melt Front Temperature Difference
The maximum temperature difference reached 27.6°C, exceeding the recommended limit of 20°C.
c. Maximum Injection Pressure
118.6 MPa, equivalent to 82% of the machine capacity, leaving limited processing margin and increasing the risk of flash.
d. Gate Freeze Time
The gate froze after 8 s of packing, leaving the final 2 s ineffective for shrinkage compensation.
e. Sink Mark Contour Analysis
The maximum sink depth reached 0.131 mm above the reinforcement ribs, creating visible cosmetic defects.
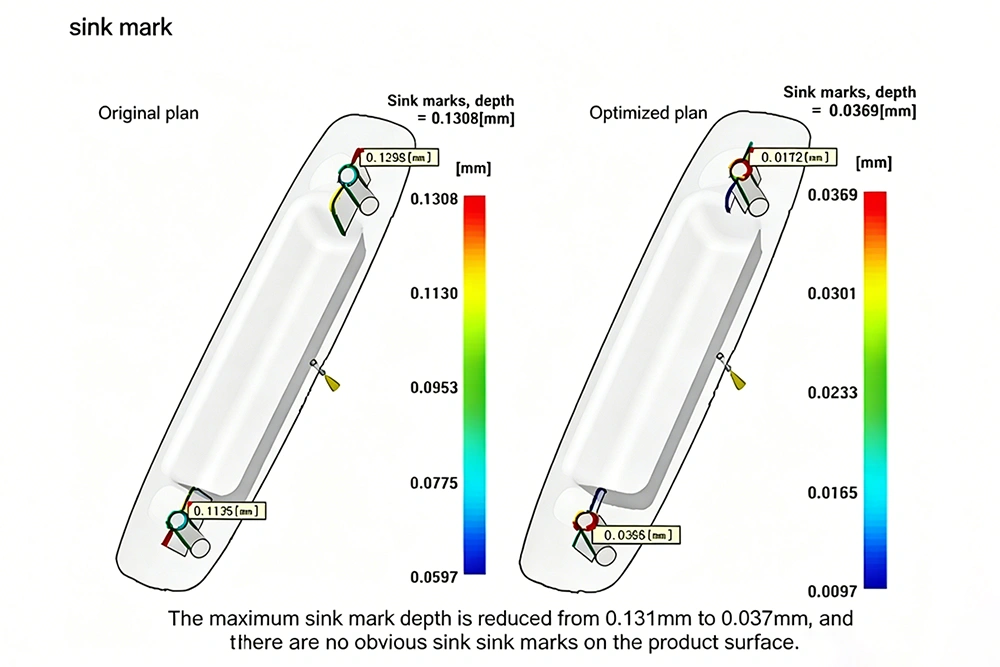
Original Sink Mark Contour Plot
f.Filling Defect Summary
The single-gate layout resulted in an excessively long flow path and uneven filling. Premature gate freeze prevented effective packing, leading to severe sink marks around the rib sections and increasing the likelihood of subsequent warpage.
3) Initial Warpage Simulation Results
Moldflow separated the total deformation into three contributing factors.
a. Deformation Contribution
Uneven shrinkage accounted for 91.2% of the total deformation, while cooling imbalance contributed 7.5% and fiber orientation only 1.3%.
b. Maximum Warpage
The maximum displacement in the Z-direction was 0.712 mm, and the assembly flatness measured was 0.68 mm, which is more than the 0.25 mm standard.
c. Wall Thickness Analysis
The thickness of the nominal wall was 2.2mm, and the thickness of the rib root was 2.8mm. The thickness difference was only 0.6 mm, which resulted in a local volumetric shrinkage of 4.488%, while the shrinkage in the surrounding area was only 2.445%. The shrinkage mismatch caused the component to be drawn towards the thicker section of rib.
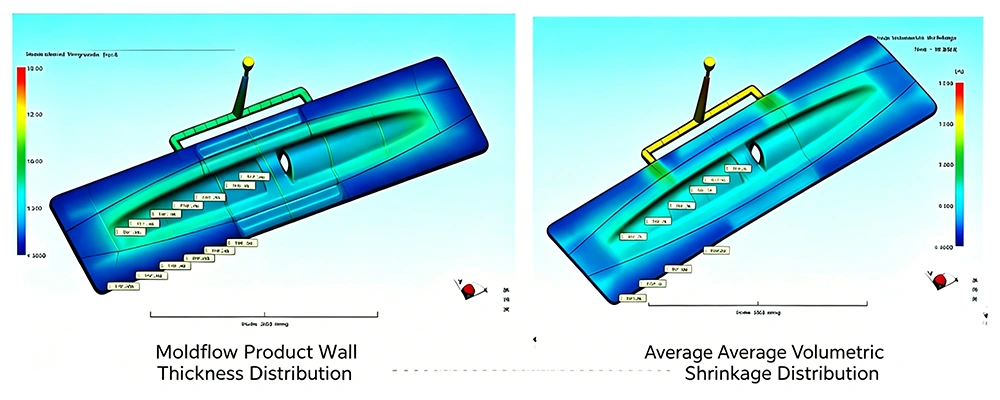
Original Wall Thickness and Volumetric Shrinkage Contour Plot
4) Layered Optimization Strategy
(Fill Balance → Structural Core-Out → Gating / Process / Cooling Optimization)
Layer 1: Product Structure Optimization (Root Solution for Uneven Shrinkage and Warpage).
Optimization Goal:Remove sudden wall thickness changes and provide more even distribution of wall thickness across part.
a. Core-Out Optimization
The thickness of the rib root has been lowered from 2.8 mm to 2.2 mm and an R1.2 radius transition has been added to eliminate sharp changes in wall thickness.
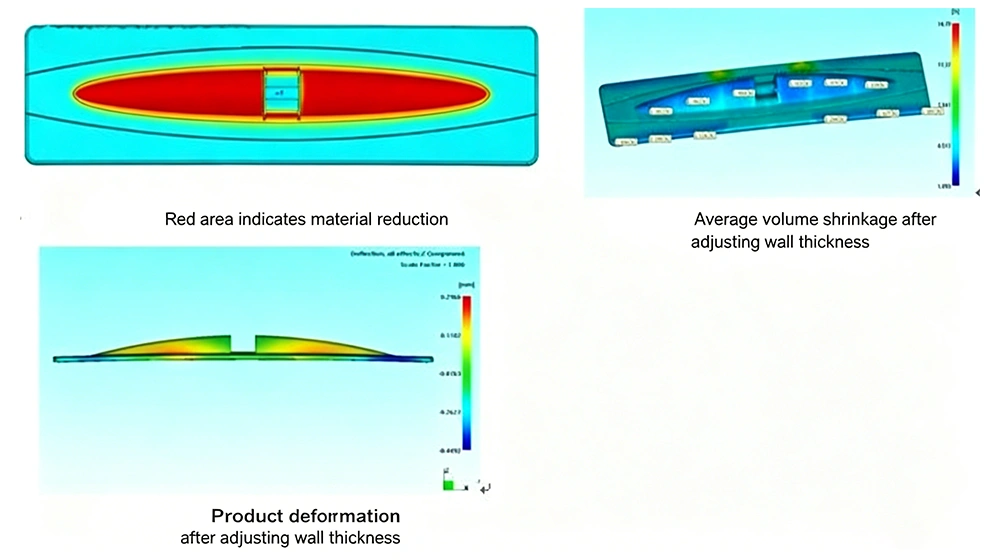
Core-Out Optimization Area
b. Auxiliary Reinforcement
0.8 mm auxiliary ribs were added at both ends of the part to balance melt orientation stress.
c. Simulation Verification
The volumetric shrinkage was between 2.31% and 2.75% (maximum difference of 0.44%) after the modification and this differential shrinkage was not the main source of differential shrinkage anymore.
Layer 2: Gating System Optimization for Balanced Filling
Symmetrical dual-gated design, instead of single-gated.
a. Runner Design
A U-shaped runner measuring 8 × 6 mm was combined with dual gates measuring 8 × 1.8 mm. The increased gate thickness delayed gate freeze.
b. Filling Synchronization
Simulation showed both melt fronts reaching the end of the part almost simultaneously, with a fill-time difference of only 0.06 s, indicating balanced filling.
c. Injection Pressure Reduction
Maximum injection pressure decreased to 82.4 MPa, only 57% of the machine capacity. Required clamp force was reduced by 24%, effectively eliminating flash risk.
Layer 3: DOE Process Optimization (Fill and Packing Coupled Optimization)
A five-factor L16 DOE simulation was performed using sink mark depth and total warpage as the evaluation criteria. The results showed that the influence of each process parameter ranked as follows:Packing Pressure > Packing Time > Melt Temperature > Fill Time > Mold Temperature
Optimal Process Parameters
- Melt Temperature: 240°C (to reduce viscosity variation and thermal shrinkage)
- Mold Temperature: 70°C
- Fill Time: 1.4 s
- Packing Pressure: 78.2 MPa (to improve shrinkage compensation)
- Packing Time: 12 s
With the optimized process, gate freeze occurred 1.6 s after the packing phase was completed, allowing effective packing throughout the entire packing cycle.
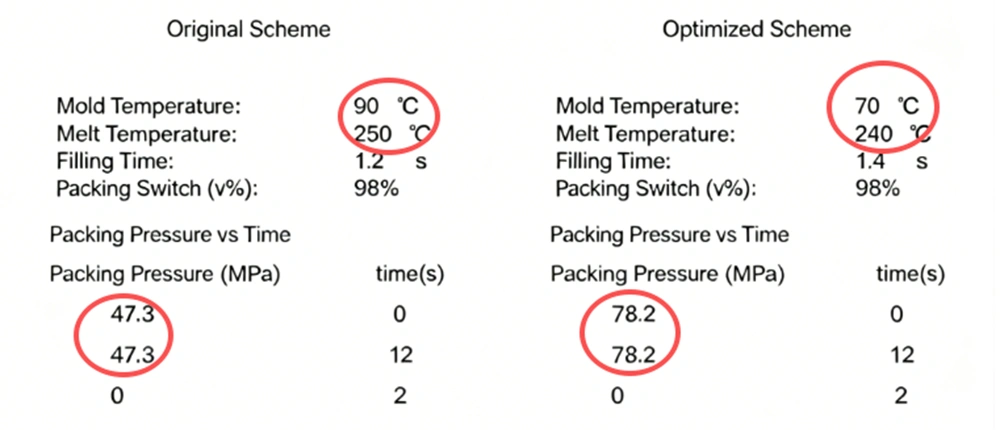
Comparison of Original and Optimized Process Parameters
Layer 4: Cooling System Optimization
The original mold design only included cooling channels on the cavity side, while the core side had no dedicated cooling.
a. Symmetrical Cooling Layout
Symmetrical φ10 mm cooling circuits were added to both the cavity and core sides, positioned 12 mm from the part surface.
b. Local Cooling Enhancement
Additional baffles were installed, and cooling channels were concentrated around the thick rib sections where heat accumulation was greatest.
c. Simulation Results
The maximum front-to-back temperature difference decreased to 11.3°C, while the contribution of cooling-induced deformation dropped from 7.5% to 1.8%.
5) Comprehensive Simulation Results Comparison
The table below summarizes the key simulation results before and after optimization.
| Evaluation Metric | Original Design | Optimized Design | Improvement | Acceptance Result |
| Maximum Sink Depth | 0.131 mm | 0.037 mm | -71.7% | Pass (≤0.05 mm) |
| Fill Time Difference | 0.32 s | 0.06 s | -81.2% | Balanced Filling |
| Maximum Injection Pressure | 118.6 MPa | 82.4 MPa | -30.5% | Reduced Machine Load |
| Premature Gate Freeze | 2 s | -1.6 s (Delayed Freeze) | — | Full Packing Effectiveness |
| Maximum Z-Direction Warpage | 0.712 mm | 0.213 mm | -70.1% | Meets Flatness Requirement |
| Volumetric Shrinkage Variation | 2.043% | 0.44% | -78.4% | Uniform Shrinkage |
| Cooling Temperature Difference | 27.6°C | 11.3°C | -59.1% | Balanced Cooling |
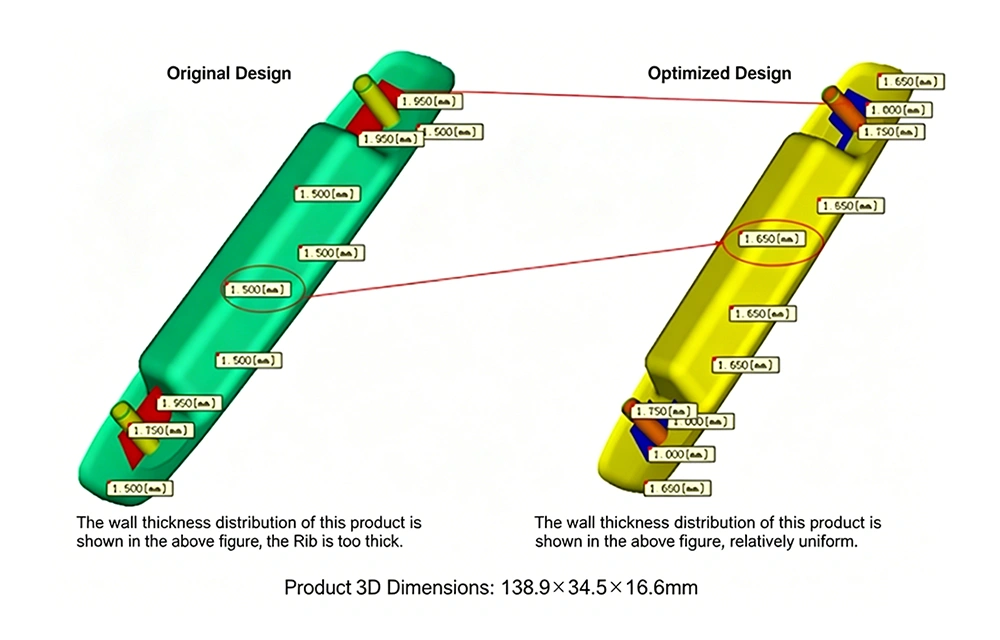
Wall Thickness Comparison Before and After Optimization
6) Optimization Summary (Fill Balance and Warpage Control)
a. Key Principles for Filling Balance Optimization
- In case of long flow and large flat components, symmetrical multi-gate arrangements should be used with less than 1 second variation in fill time.
- For cosmetic components, gate thickness should be at least 60% of the nominal wall thickness in order to delay gate freeze.
- In case the difference in temperature of the melt front is more than 20°C, the mold temperature and the injection speed need to be adjusted.
b. Warpage Optimization Priority (Highest to Lowest Impact)
- Primary Optimization (Highest Impact, Lowest Cost):Maintain uniform wall thickness and eliminate abrupt wall-thickness transitions.
- Secondary Optimization:Use symmetrical gate layouts to balance filling and shrinkage.
- Tertiary Optimization:Optimize cooling channel layout to minimize temperature differences across the part.
- Fourth-Level Optimization:Fine-tune packing pressure, packing time, melt temperature, and mold temperature through DOE process optimization.
c. Common Pitfalls to Avoid
- Only process changes to reduce the warpage:Process optimization can only reduce warpage by 20%–30%. If deformities are the result of unequal thickness of the wall, structural modification is typically the best solution.
- Gate Freeze Time Ignored:If the gate freezes prematurely before packing is finished, then there is no way to eliminate the warpage or sink marks by increasing the packing pressure.
- Simply doing filling analysis without coupled warpage simulation:Doing filling analysis does not necessarily mean that a part is dimensionally stable.
- Uneven wall thickness and asymmetric cooling can still produce significant warpage.
7. Moldflow Analysis vs DFM Review
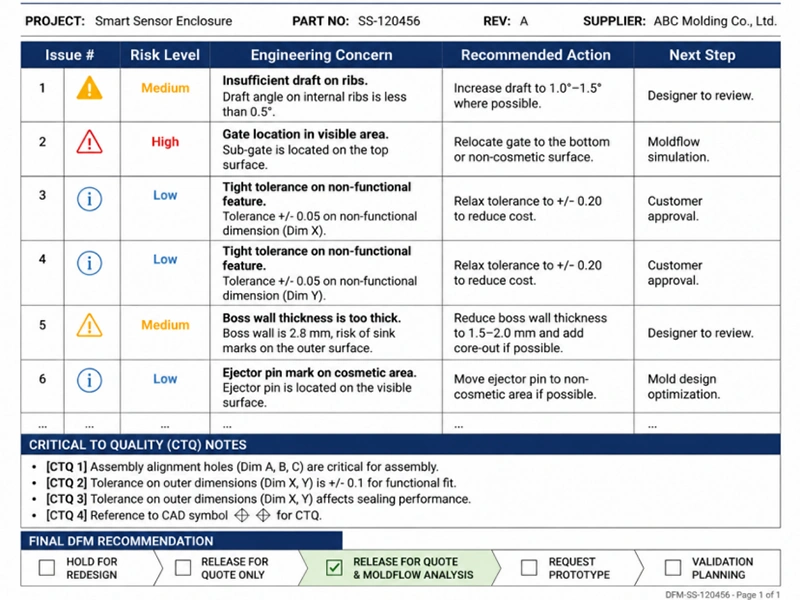
Both Moldflow Analysis and DFM Review are mentioned together but have different functions. DFM Review determines if a part can be manufactured based on engineering experience and Moldflow Analysis determines how the part will behave when it is being injected molded.
| Item | Moldflow Analysis | DFM Review |
| Main Method | Finite element simulation based on polymer flow behavior and thermal analysis | Engineering review based on mold design and manufacturing experience |
| Focus | Quantifies filling pressure, shrinkage, and warpage with measurable simulation data | Evaluates manufacturability by reviewing draft angles, wall thickness, radii, and other structural features |
| Typical Checks | Identifies complex molding risks involving filling, cooling, shrinkage, and fiber orientation | Identifies visible design issues and manufacturability concerns before tooling |
| Best Timing | Best suited for complex, high-precision, or high-risk plastic parts where simulation is required | Best Suited: Routine plastic parts with engineering experience |
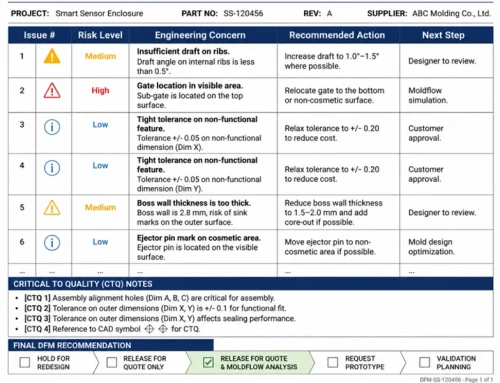
DFM Review is the first engineering checkpoint during product development. It helps eliminate obvious structural issues before tooling begins. Moldflow Analysis goes a step further by predicting how molten plastic will actually flow, pack, cool, shrink, and deform inside the mold.
For more complex injection molding projects, it is best to use a combination of the two techniques. DFM Review is used to suggest design problems and Moldflow Analysis is used to check if the optimized design will behave as it was designed to during production.
8. Conclusion
Moldflow Analysis can be used to identify the problems of filling, cooling, shrinkage, and warpage prior to tooling. It should be considered as a risk control method, not an extra engineering expense, for high-precision parts, automotive parts, medical devices, thin wall components, glass-filled components, or multi-gate components.
Before steel is cut, we perform DFM review, Moldflow analysis and leverage our experience in tooling design to recognize molding risks early at Holly Plastic Parts and offer practical design and mold optimization solutions. For high precision or complex molded parts, find out more about our injection molding services or reach out to our engineering staff for design review and support with tooling.