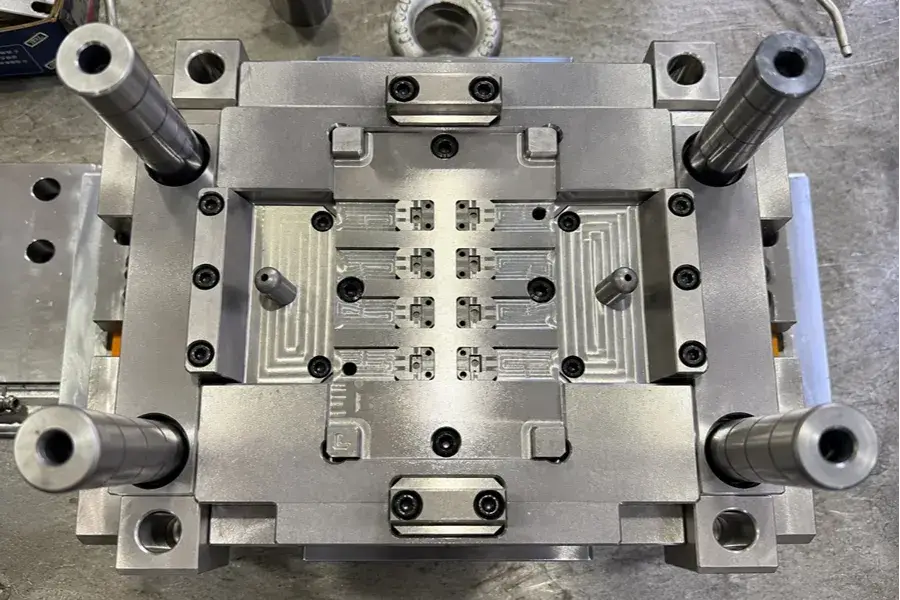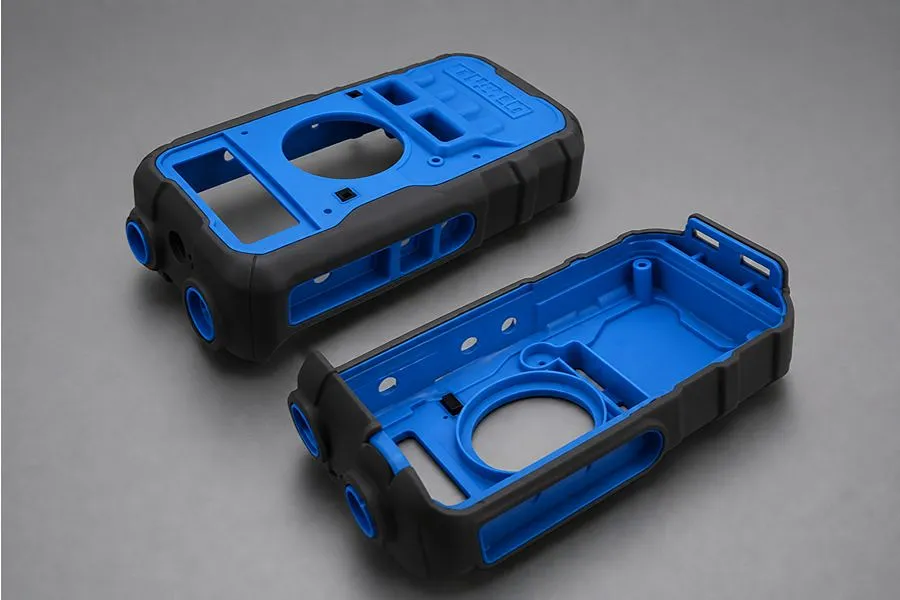
Plastic shrinkage is one of the most common issues in injection molding and one of the primary factors affecting dimensional accuracy. A dimensional deviation of several millimeters may have little impact on general cosmetic parts. However, for precision connectors, gears, automotive components, or medical devices, even a dimensional change of 0.1 mm can result in assembly difficulties, abnormal noise, leakage, or even the rejection of an entire production batch.
Based on engineering experience gained from multiple injection molding projects completed by the Holly team, this guide systematically summarizes the mechanisms of plastic shrinkage, the major influencing factors, material differences, and practical solutions from selected engineering cases. The objective is to help product design engineers identify shrinkage risks early in product development, reduce mold trial iterations, and improve mass production stability.
1. What Is Injection Molding Shrinkage
Plastic shrinkage refers to the dimensional reduction that occurs after molten plastic fills the mold cavity and cools to a solid state, as the material contracts in volume during solidification.
For clarity, this guide defines the shrinkage value measured under standard test conditions as the base shrinkage rate. The actual shrinkage of a molded part, after being constrained by part geometry, mold design, and molding conditions, is referred to as constrained shrinkage. Mold shrinkage allowance and dimensional compensation should normally be determined based on the measured constrained shrinkage rate.
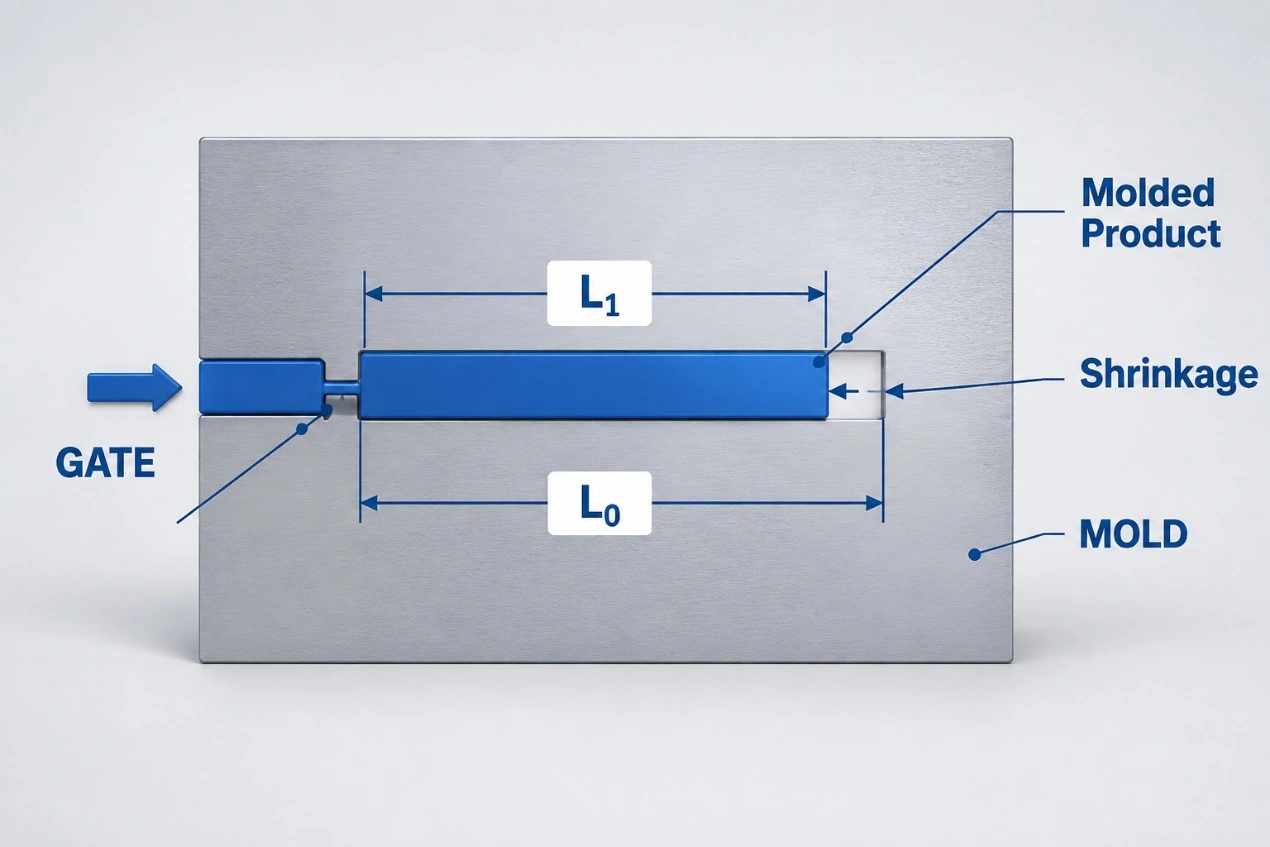
Injection Molding Shrinkage Mechanism
Amorphous plastics (ABS, PC, PMMA, PC/ABS): These materials do not form a distinct crystalline structure during cooling. Their volume change mainly results from thermal contraction. As a result, they generally exhibit lower shrinkage, a narrower shrinkage range, smaller directional variation, and better dimensional stability.
Semi-crystalline plastics (PP, PA6/66, POM, PBT): These materials crystallize during cooling, causing the molecular structure to become more compact. Consequently, they exhibit greater volumetric contraction, higher base shrinkage, and a wider shrinkage range. Although glass fiber reinforcement significantly reduces overall shrinkage, the fibers align with the melt flow direction, creating different shrinkage values between the flow and transverse directions.
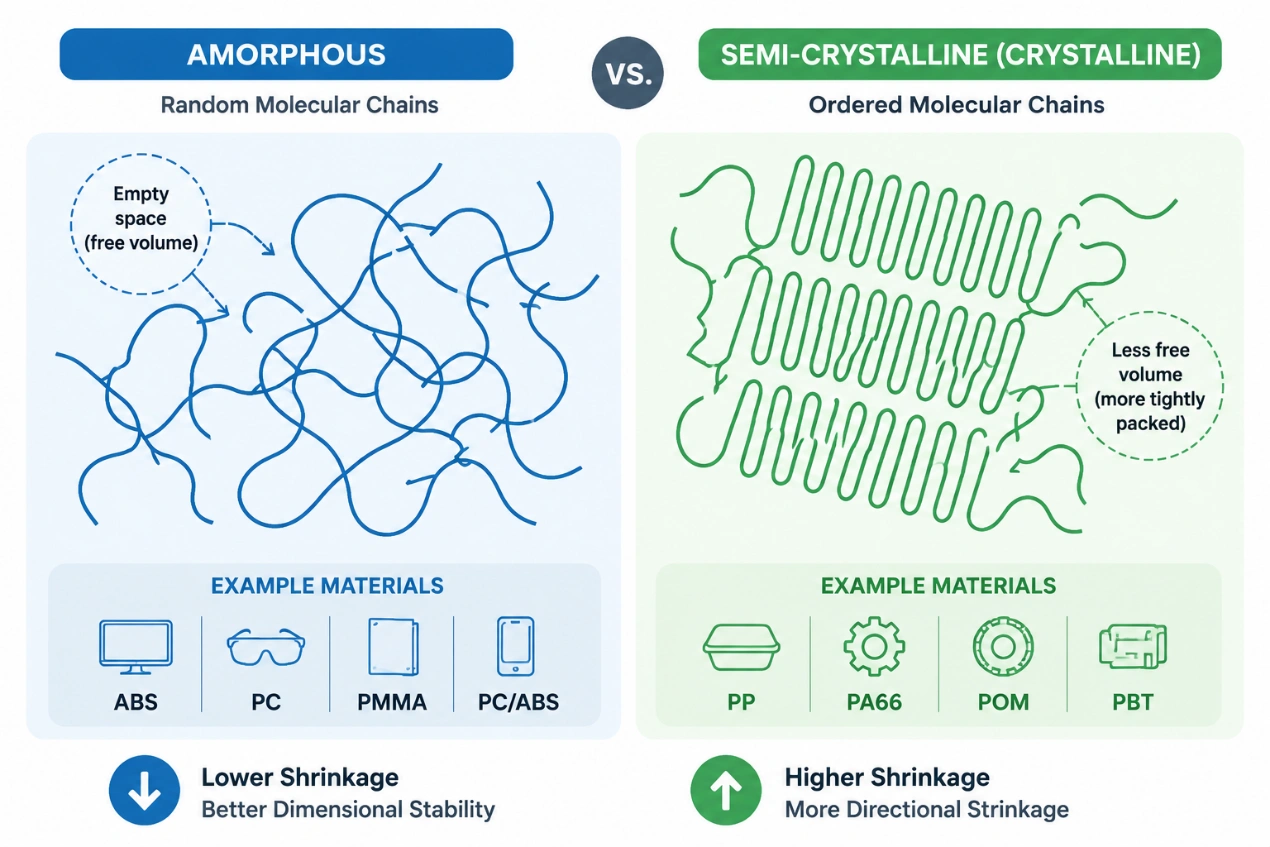
Amorphous shrinkage and crystallization shrinkage
2. Comparison of Base Shrinkage Rates of Common Plastic Materials
Material datasheets typically specify a shrinkage range, such as 0.5%–0.7% or 1.2%–2.0%. Note that these values do not represent the actual shrinkage of the final molded part. They are reference values measured under standard test conditions. The shrinkage data presented below are compiled from publicly available material supplier TDSs, industry experience, and project data collected by the Holly team. They are intended only as a reference for preliminary mold design.
1) Base Shrinkage Rates of General-Purpose Plastics
General-purpose plastics are widely used in consumer electronics, home appliances, packaging, and daily consumer products. In general, amorphous materials provide better dimensional stability, while semi-crystalline materials exhibit relatively higher shrinkage.
| Material | Crystallinity | Flow Direction Shrinkage (%) | Transverse Direction Shrinkage (%) | Shrinkage Characteristics |
| PP | Semi-crystalline | 1.5–2.2 | 1.8–2.5 | High shrinkage with strong directional dependence. Widely used for thin-wall parts and consumer products. |
| PE (HDPE/LDPE) | Semi-crystalline | 1.5–3.0 | 1.8–3.5 | High shrinkage with moderate dimensional stability. Commonly used for containers, packaging, and pipe fittings. |
| ABS | Amorphous | 0.4–0.6 | 0.5–0.7 | Uniform shrinkage and good dimensional stability. Commonly used for cosmetic parts and household appliances. |
| PS (GPPS/HIPS) | Amorphous | 0.3–0.7 | 0.3–0.7 | Low shrinkage and good processability. Suitable for transparent parts and packaging applications. |
| PMMA (Acrylic) | Amorphous | 0.3–0.6 | 0.3–0.6 | Low shrinkage and excellent transparency. Commonly used for optical components and lighting products. |
From a dimensional stability perspective, amorphous materials such as ABS and PS are generally easier to control.
2) Base Shrinkage Rates of Engineering Plastics
Engineering plastics generally offer superior mechanical performance, but their shrinkage characteristics vary significantly by material.
| Material | Crystallinity | Flow Direction Shrinkage (%) | Transverse Direction Shrinkage (%) | Shrinkage Characteristics |
| PC | Amorphous | 0.5–0.7 | 0.5–0.7 | Low shrinkage with high dimensional accuracy. Suitable for precision structural parts. |
| PA6 | Semi-crystalline | 0.8–1.5 | 1.0–1.8 | High moisture absorption. Dimensional variation is relatively significant. |
| PA66 | Semi-crystalline | 1.0–1.8 | 1.2–2.0 | Higher shrinkage with excellent wear resistance and heat resistance. |
| POM | Semi-crystalline | 1.8–2.3 | 2.0–2.5 | High shrinkage with good dimensional stability. Suitable for gears and sliding components. |
| PBT | Semi-crystalline | 1.2–2.0 | 1.5–2.2 | Stable molding performance. Widely used for electrical connectors. |
| PET | Semi-crystalline | 1.5–2.2 | 1.8–2.5 | Fast crystallization rate. Mold temperature requires careful control. |
| PPS | Semi-crystalline | 0.6–1.2 | 0.7–1.3 | High heat resistance and low shrinkage. Commonly used for precision electronic components. |
| PEEK | Semi-crystalline | 1.0–1.4 | 1.2–1.6 | High-performance engineering plastic with excellent dimensional stability. |
| LCP | Liquid Crystal Polymer | 0.1–0.5 | 0.3–0.8 | Very low shrinkage and outstanding flowability. Suitable for ultra-thin-wall parts and precision electronic connectors. |
3) Shrinkage Rates of Glass Fiber Reinforced Plastics
Glass fiber reinforcement (GF) is one of the most common methods used to reduce shrinkage and increase stiffness. As the glass fiber content increases, the overall shrinkage of most materials decreases.
| Material | Crystallinity | Flow Direction Shrinkage (%) | Transverse Direction Shrinkage (%) | Shrinkage Characteristics |
| PP + GF20 | Semi-crystalline | 0.8–1.2 | 1.2–1.8 | Overall shrinkage decreases noticeably, while directional differences begin to increase. |
| PP + GF30 | Semi-crystalline | 0.4–0.8 | 0.8–1.5 | Better dimensional stability but more susceptible to anisotropic warpage. |
| PA6 + GF30 | Semi-crystalline | 0.3–0.6 | 0.8–1.2 | Low shrinkage and high stiffness. Widely used in automotive components. |
| PA66 + GF30 | Semi-crystalline | 0.3–0.5 | 0.8–1.1 | High strength with significant shrinkage differences between the flow and transverse directions. |
| PBT + GF30 | Semi-crystalline | 0.2–0.5 | 0.6–1.0 | Commonly used for electrical connectors and precision structural parts. Provides good dimensional stability. |
| PPS + GF40 | Semi-crystalline | 0.1–0.3 | 0.3–0.6 | Extremely low shrinkage. Suitable for high-temperature precision components, although anisotropy still requires consideration. |
Lower shrinkage does not necessarily mean better performance for glass fiber reinforced materials. The difference between shrinkage in the flow and transverse directions is the primary cause of warpage. When this difference exceeds 0.5%, Moldflow simulation with directional shrinkage compensation is recommended.
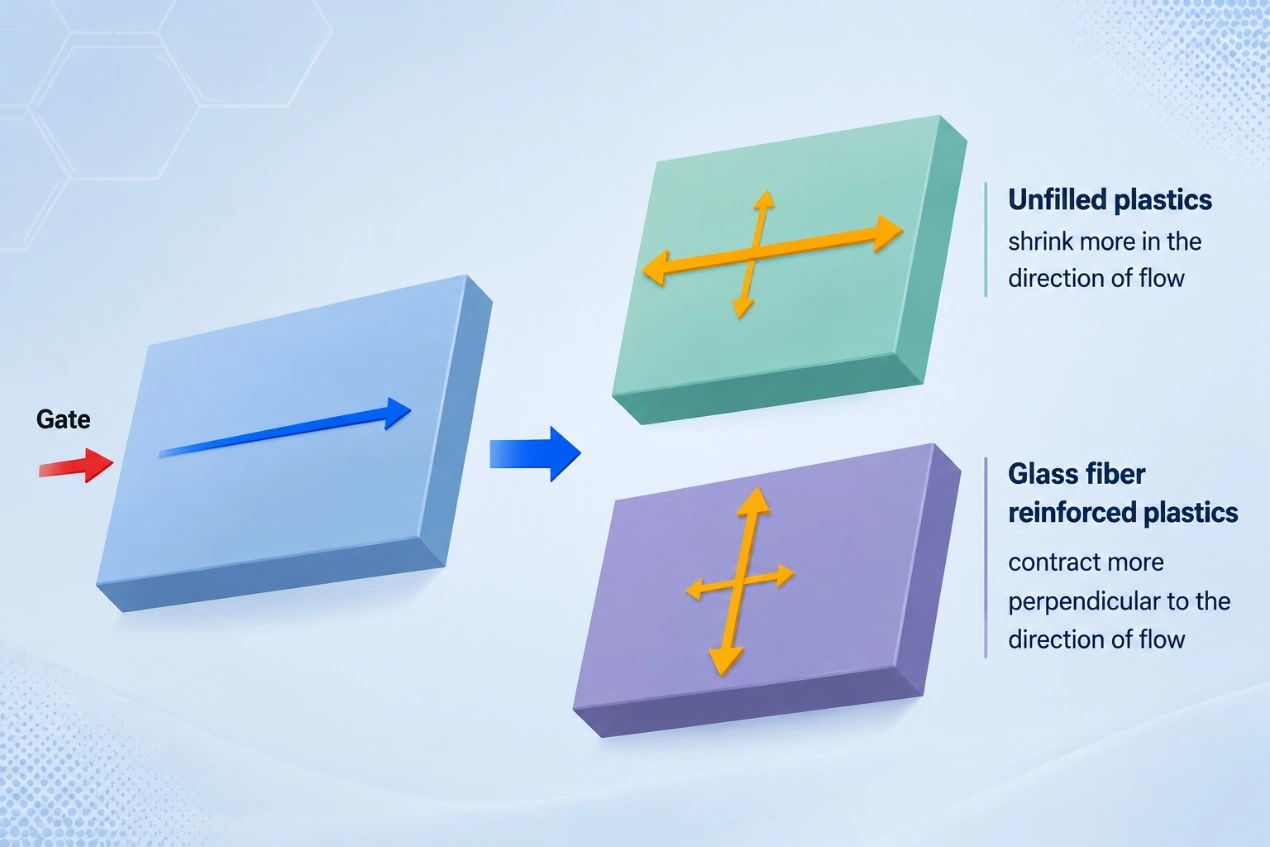
Glass fiber reinforced plastic shrinkage
3. Main Factors Affecting Plastic Shrinkage
Plastic shrinkage does not depend on the material alone. Even when the same resin grade is used, differences in part geometry, mold design, and molding conditions can produce significant dimensional variation. Based on the Holly team’s experience across multiple projects, the material type establishes the basic shrinkage range, the part structure determines whether shrinkage remains uniform, the mold design controls packing and cooling performance, and the molding process provides the final optimization and fine adjustment during mass production.
1)Material Type and Polymer Structure
The material itself determines the approximate shrinkage range.
Amorphous plastics such as ABS, PC, and PMMA have relatively low shrinkage and limited directional variation. For example, a standard ABS specimen with a wall thickness of 2 mm has an average shrinkage rate of approximately 0.5%, with a typical fluctuation of about ±0.1%.
Semi-crystalline plastics such as PP, PA, POM, and PBT have higher shrinkage and a wider variation range. Under the same conditions, unfilled PP can reach a shrinkage rate of approximately 2.0%, with fluctuations of up to ±0.4%.
Glass fiber restricts resin shrinkage but increases the difference between shrinkage directions. For example, the flow-direction shrinkage of unfilled PA66 is approximately 1.4%. Adding 15% glass fiber can reduce it to 0.8%, while adding 30% glass fiber can reduce it further to 0.5%. However, transverse shrinkage may still reach 1.1%. Therefore, although glass fiber reinforced materials have lower overall shrinkage, their anisotropy makes them more susceptible to warpage.
The percentage of recycled material and the moisture content of the resin also affect dimensional stability. When 30% recycled ABS is added, a stable shrinkage rate of approximately 0.5% may expand to a range of 0.4%–0.9%. Hygroscopic materials such as PC and PA may also undergo hydrolysis, generate bubbles, or develop localized collapse if drying is insufficient, resulting in shrinkage variation and sink marks.
2)Product Structure Design
Product structure is a major source of localized sink marks, non-uniform shrinkage, and warpage. Common risks include abrupt wall-thickness transitions, thick bosses, deep ribs, solid screw posts, and localized resin accumulation. In one typical project handled by Holly, the main wall thickness was 1.5 mm while the local thickness reached 4 mm. The thick section cooled approximately 30%–50% more slowly, and the local shrinkage difference reached about 0.8%. Even when the material and process remained unchanged, the thick section was more likely to develop sink marks, internal voids, and dimensional deviation.
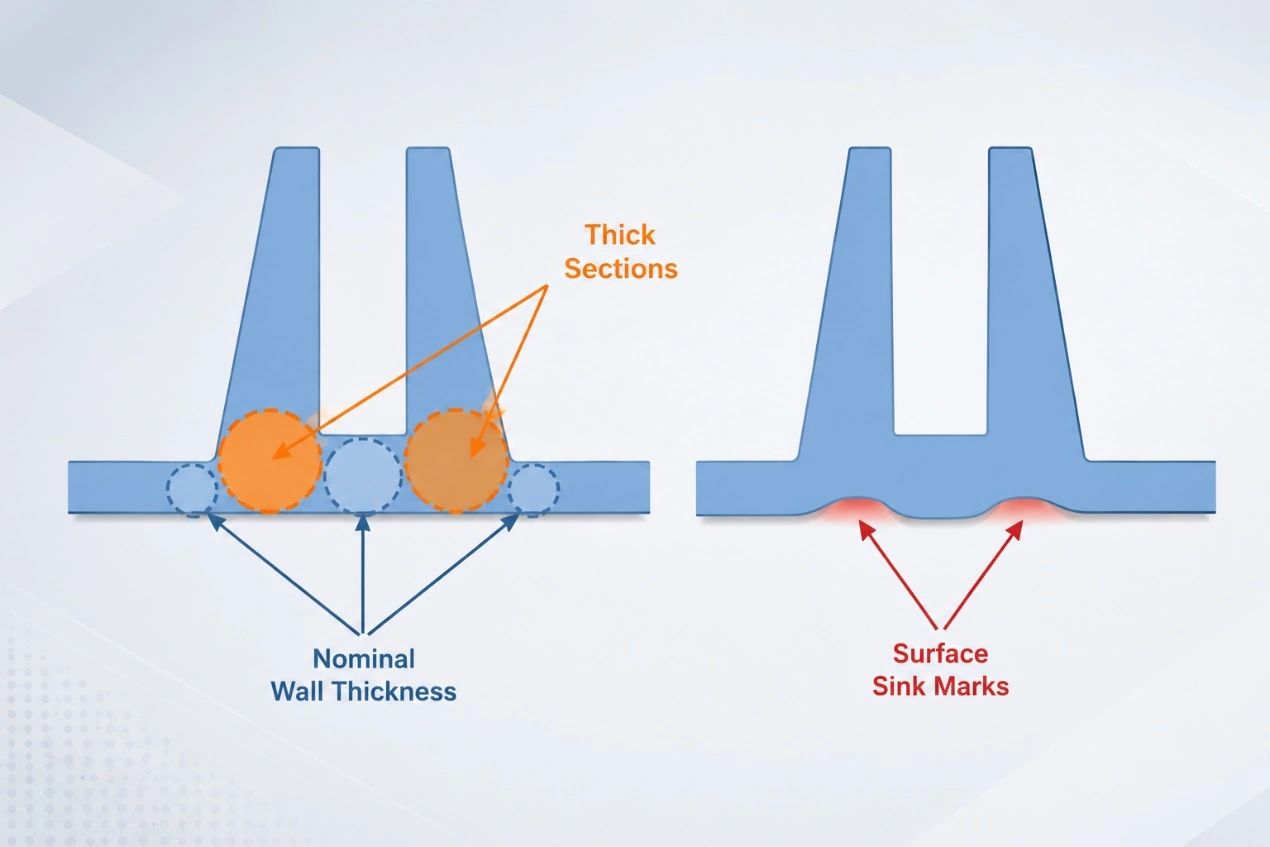
Shrinkage Caused by Abrupt Wall-Thickness Changes
Metal inserts change the local cooling rate. The plastic around the insert cannot shrink freely, which can cause internal stress to accumulate. If multiple inserts are arranged asymmetrically, they may also distort the entire part.
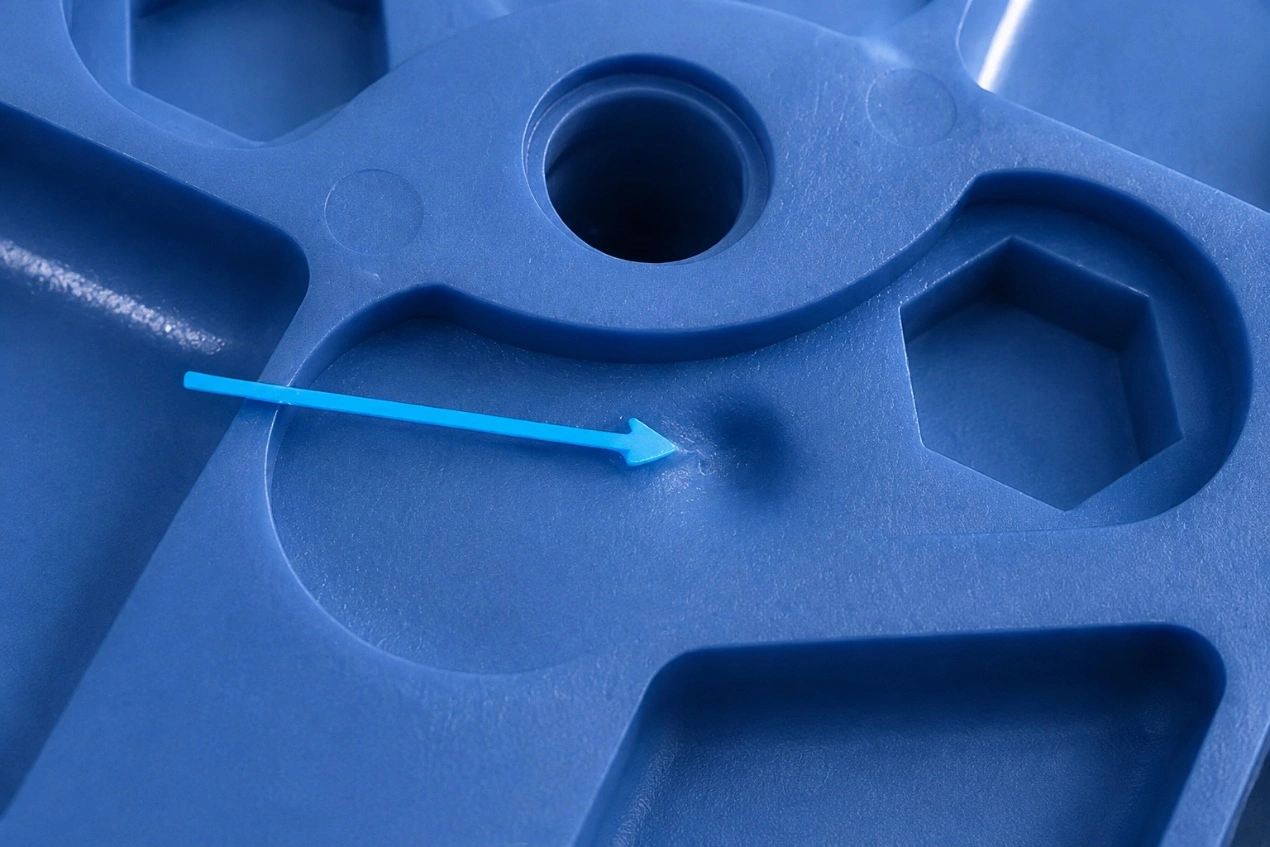
Example of Thick-Section Shrinkage
3)Mold Design
Mold design determines how the melt flows, packs, and cools, and it directly affects directional dimensions and shrinkage uniformity.
a) Gate Location and Size: If the gate is too small or located too far from a thick section, it may freeze before the thick section receives sufficient packing material, resulting in sink marks and undersized dimensions. When the gate thickness is approximately 70% or more of the part wall thickness, the gate generally remains open longer and supports more effective packing.
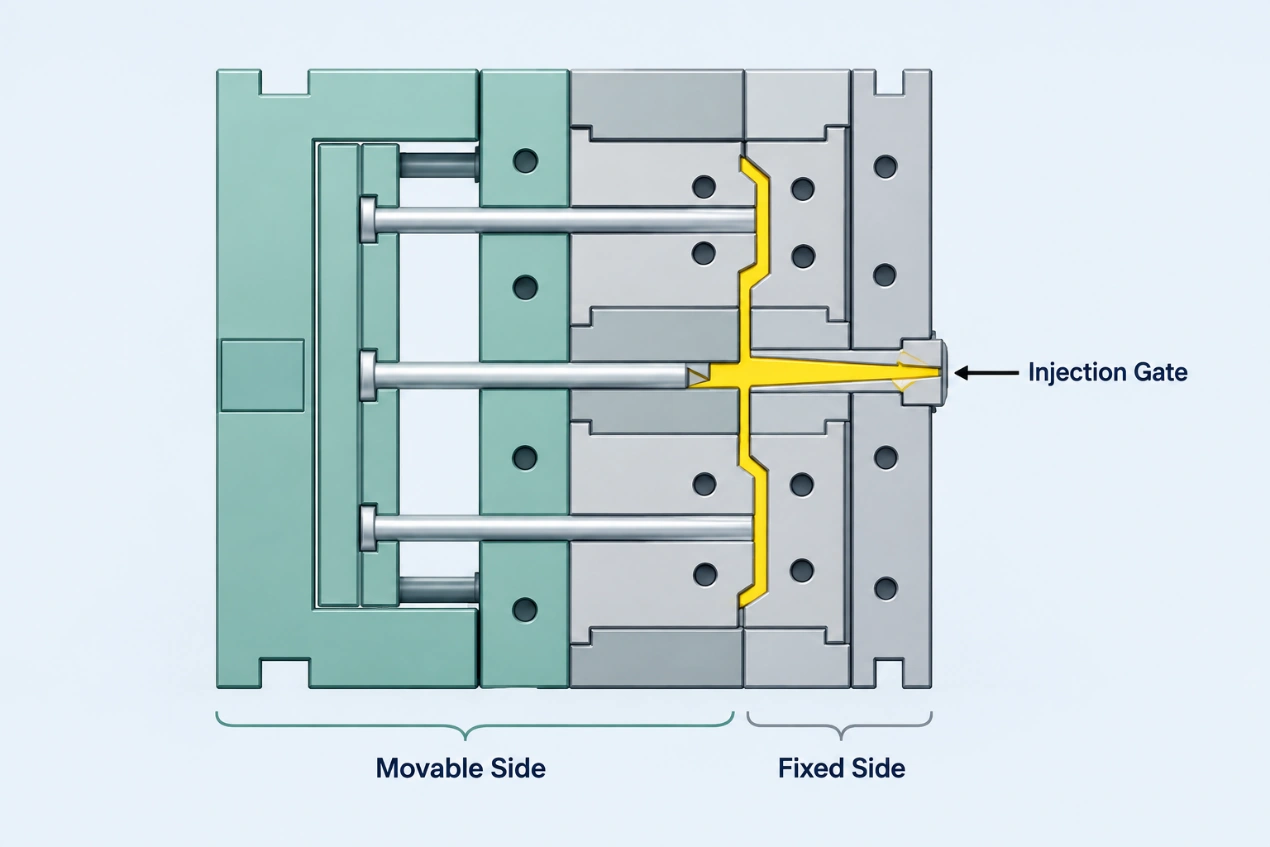
Gate Location
b) Cooling System: Uneven cooling often causes deformation more readily than a high average shrinkage rate. When the temperature difference between the core and cavity sides exceeds 5°C, the resulting shrinkage difference between the two surfaces may already be sufficient to create visible warpage. For precision parts, the temperature variation across mold areas should generally remain within approximately ±3°C. Cooling should be strengthened around thick sections, ribs, and boss areas.
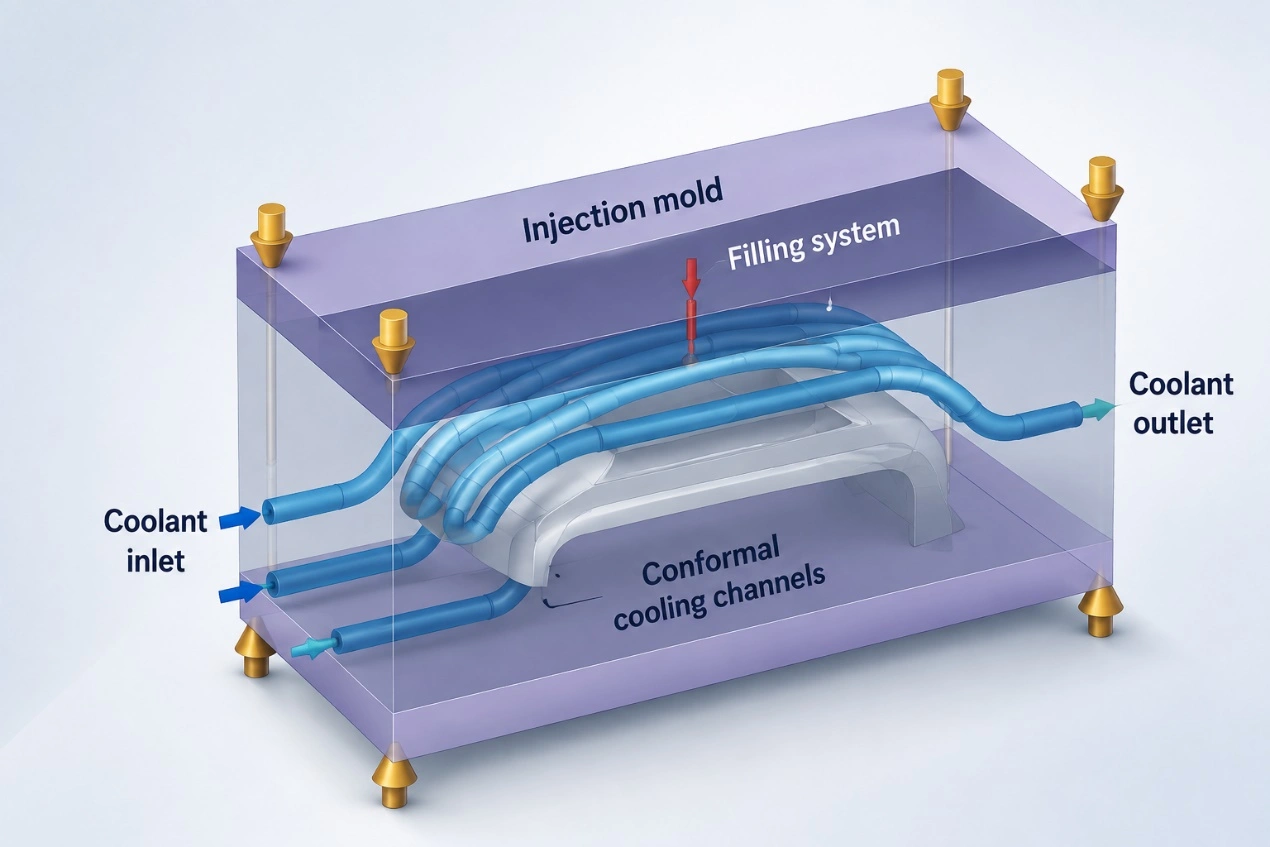
Mold Cooling System
c) Cavity Shrinkage Compensation: For parts with uniform wall thickness and simple geometry, the cavity dimension can be estimated as follows:
L_mold = L_part × (1 + S_average) + Δ
Where: L_mold is the machined mold cavity dimension, L_part is the nominal dimension on the product drawing, S_average is the measured average material shrinkage rate expressed as a decimal, and Δ is the allowance for polishing, mold fitting, and subsequent correction. This allowance may be positive or negative.Glass fiber reinforced materials should not use a single average shrinkage rate. Separate compensation values should be applied in the flow and transverse directions; otherwise, both the length and width may fall outside tolerance.
d) Venting Design: Insufficient venting does not directly change the material’s base shrinkage rate, but it can cause incomplete local filling, burn marks, and poor packing-pressure transfer, which ultimately reduce dimensional stability.
4)Molding Process Parameters
After the material, product, and mold have been finalized, the molding process becomes the most direct adjustment method during mass production. The parameters with the greatest influence on shrinkage include packing time, packing pressure, mold temperature, melt temperature, and cooling time.
a) Packing Pressure and Packing Time: Packing continues to feed melt into the cavity to compensate for volume loss during cooling. Insufficient packing can cause sink marks, undersized dimensions, and inadequate internal density. For example, the gate freeze time of a PA66 part with a 3 mm wall thickness was approximately 5 seconds. With a packing time of 3 seconds, the sink-mark depth at the rib root was approximately 0.28 mm. After extending the packing time to 5 seconds, the sink-mark depth decreased to approximately 0.06 mm. Increasing the packing pressure from 70 MPa to 100 MPa reduced the overall shrinkage rate by approximately 0.2%. However, once the gate freezes, extending the packing time further generally does not improve dimensions and only increases the molding cycle.
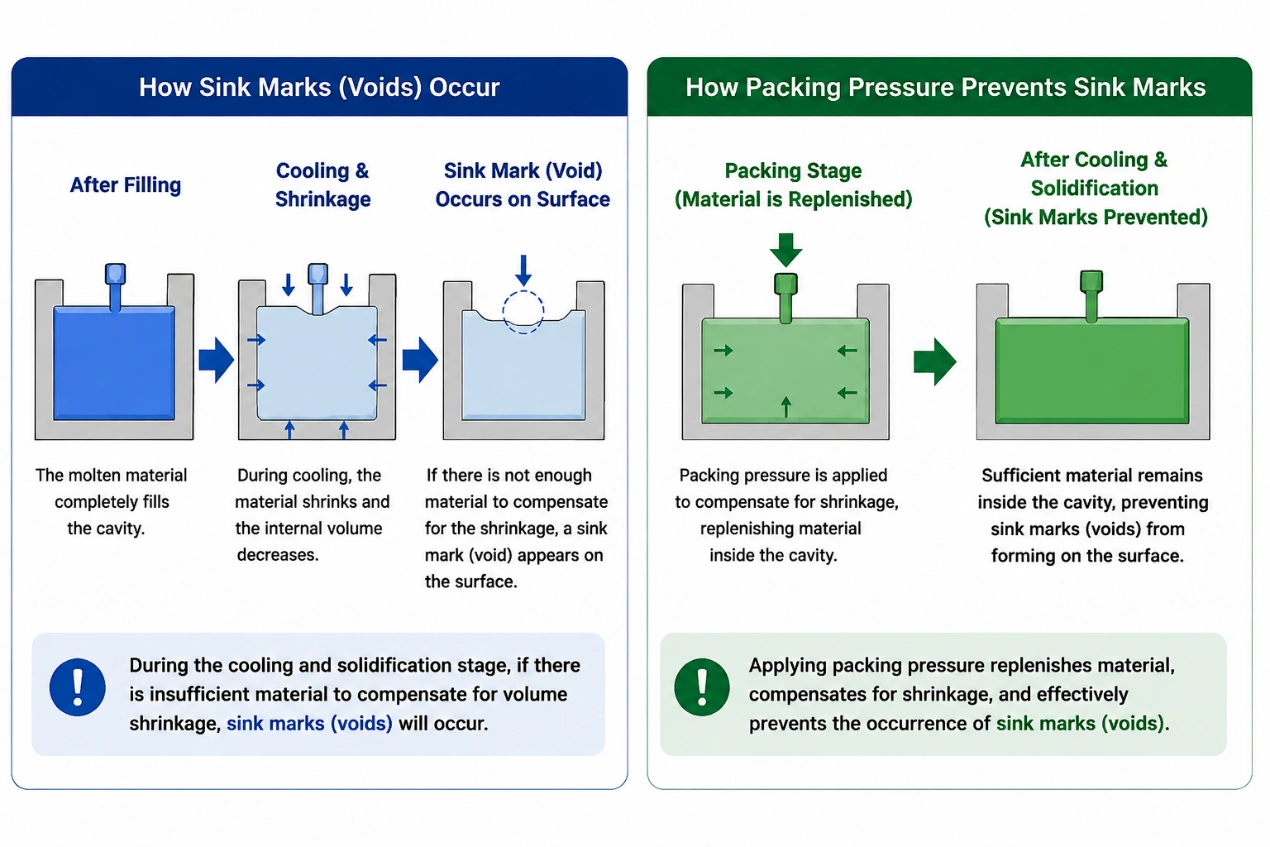
Formation and Prevention of Sink Marks
b) Mold Temperature: Mold temperature has a particularly strong effect on semi-crystalline materials. A higher mold temperature increases the crystallinity of materials such as PP, PA, and POM, which raises the final shrinkage rate. For example, PP has a shrinkage rate of approximately 1.7% at a mold temperature of 30°C. When the mold temperature increases to 60°C, shrinkage may rise to 2.1%. For amorphous materials such as ABS and PC, a higher mold temperature usually helps reduce residual stress but has a relatively limited effect on shrinkage.
c) Melt Temperature and Cooling Time: A higher melt temperature can improve flow and packing-pressure transfer. However, excessive temperature may degrade the material, increase shrinkage variation, and cause defects such as splay and brittleness. If cooling is insufficient, the part will continue to shrink after ejection, and its dimensions after 24 hours may be noticeably smaller than those measured immediately after molding.
4. Actual Mass Production Failures Caused by Shrinkage and Engineering Solutions
Case 1: Batch Warpage of a PP Appliance Base
Failure: The part was a PP copolymer appliance base with a 2.5 mm wall thickness and ribs around the perimeter. The first mold-trial parts met the dimensional requirements. However, during continuous mass production, all four corners warped upward, the assembly gap exceeded 0.6 mm, and the entire batch was rejected.
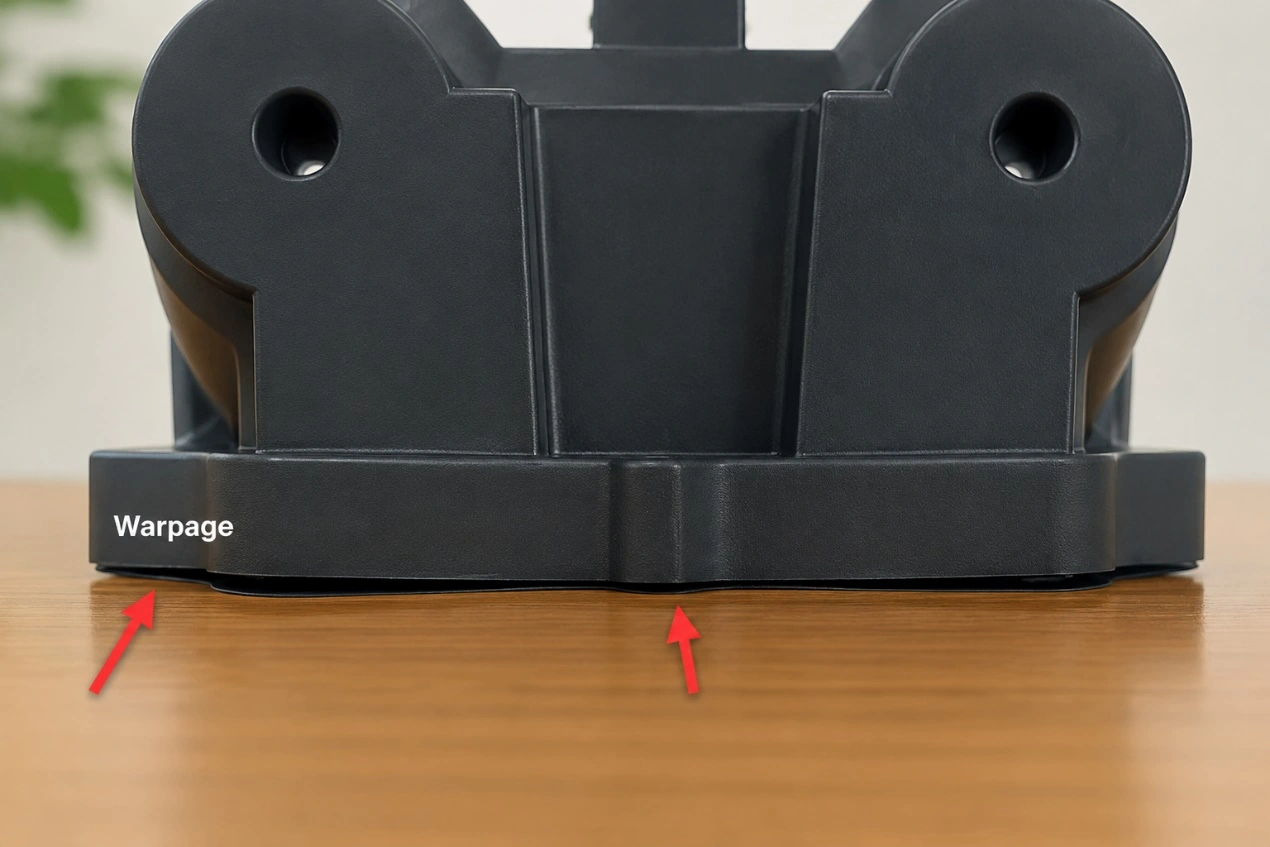
Base Warpage
Root Cause Analysis: ① Material: Unfilled semi-crystalline PP was affected by melt-flow orientation and structural constraints. Shrinkage was approximately 1.6% in the flow direction and 2.3% in the transverse direction, creating a directional difference of about 0.7%; ② Mold: The cooling channels covered only the flat areas, with no conformal cooling around the rib roots. The temperature difference between the core and cavity sides reached 6°C, causing uneven shrinkage on the two surfaces; ③ Process: The packing time was only 3 s, while the gate freeze time was 5 s. The thick rib areas therefore received insufficient packing, resulting in unbalanced shrinkage stress.
Systematic Corrective Actions: ① Material modification: Replace the unfilled PP with PP containing 20% talc. This reduced transverse shrinkage to 1.4% and narrowed the directional shrinkage difference to 0.3%; ② Mold modification: Add conformal cooling channels around the rib areas and use two independent mold-temperature-control circuits to keep the temperature variation across the mold within 2°C. Increase the side-gate thickness to extend gate freeze time; ③ Process optimization: Increase packing pressure from 60 MPa to 90 MPa, extend packing time from 3 s to 6 s, and increase cooling time to 12 s.
Case 2: Batch Sink Marks in a Thick-Wall Medical PA66 Precision Grasper
Failure: The part was a laparoscopic grasper component with a transition from a 4 mm thick section to a 1.5 mm thin section. The material was PA66+30GF. Sink marks at the rib roots reached a depth of 0.5 mm, resulting in cosmetic rejection. The yield rate was only 65%, and rework costs were high.
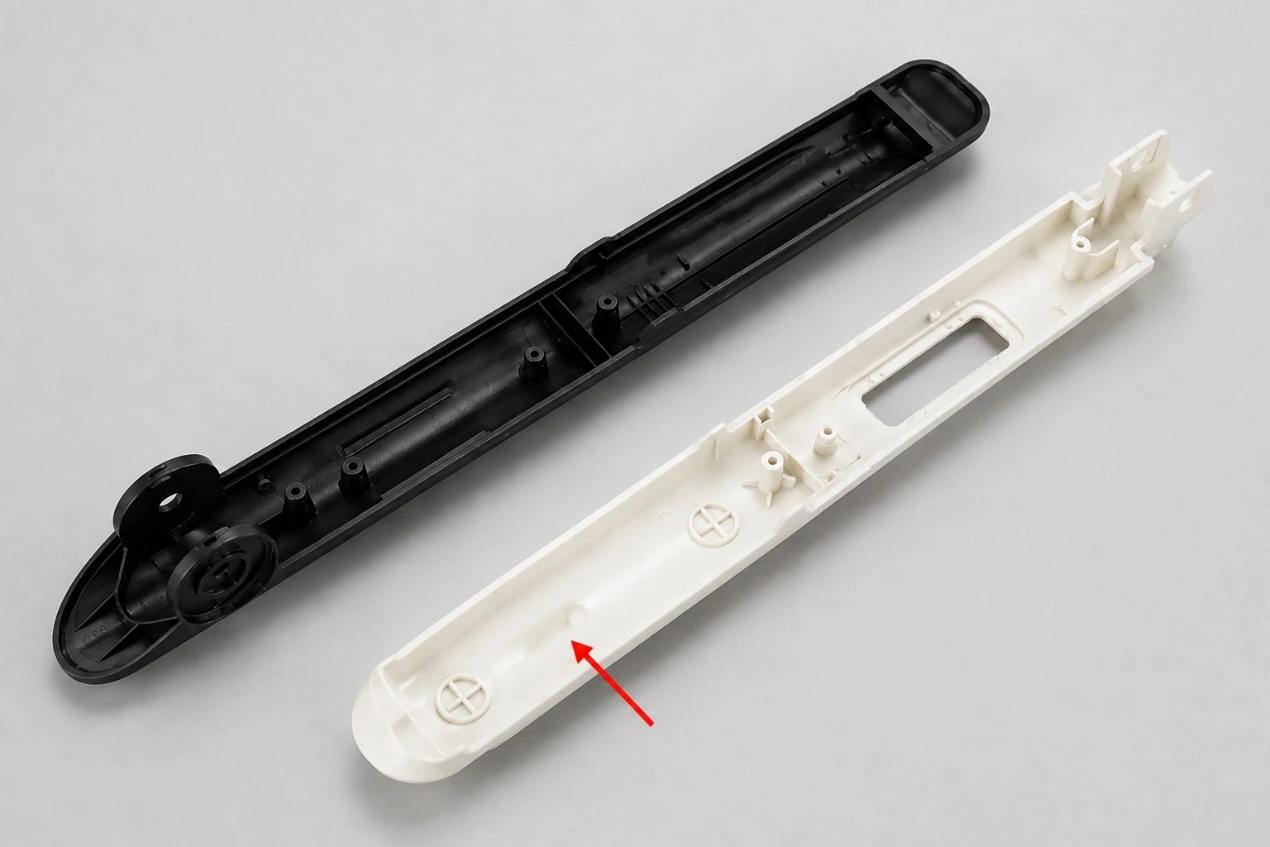
Sink Marks on a Medical PA66 Injection-Molded Part
Root Cause Analysis: The wall-thickness ratio exceeded 2:1, causing the thick section to cool slowly. The gate was located in the thin-wall area and froze after approximately 3 seconds. Once the gate froze, the thick section could no longer receive additional material during packing, and cooling shrinkage of the melt created a surface depression.
Corrective Actions: ① Product structure optimization: Core out the thick section and reduce material accumulation, standardizing the wall thickness at 2.2 mm to eliminate the abrupt transition. Reduce the rib thickness to 55% of the nominal wall thickness; ② Mold modification: Relocate the gate to the main wall area corresponding to the original thick section, increase the gate diameter from 0.6 mm to 1.0 mm, and add a local cooling channel; ③ Process adjustment: Increase packing pressure from 80 MPa to 100 MPa and extend packing time from 3 s to 5 s. Maintain the mold temperature at 80°C with a temperature variation of no more than 3°C.
Case 3: Dimensional Nonconformance Caused by Recycled ABS Shrinkage Variation in an Electronic Housing
Failure: The part was an ABS consumer-electronics housing with an assembly tolerance of ±0.05 mm. To reduce cost, the supplier added 35% recycled ABS. After one week of mass production, the parts became undersized by 0.12 mm and could no longer be assembled. All housings were rejected.
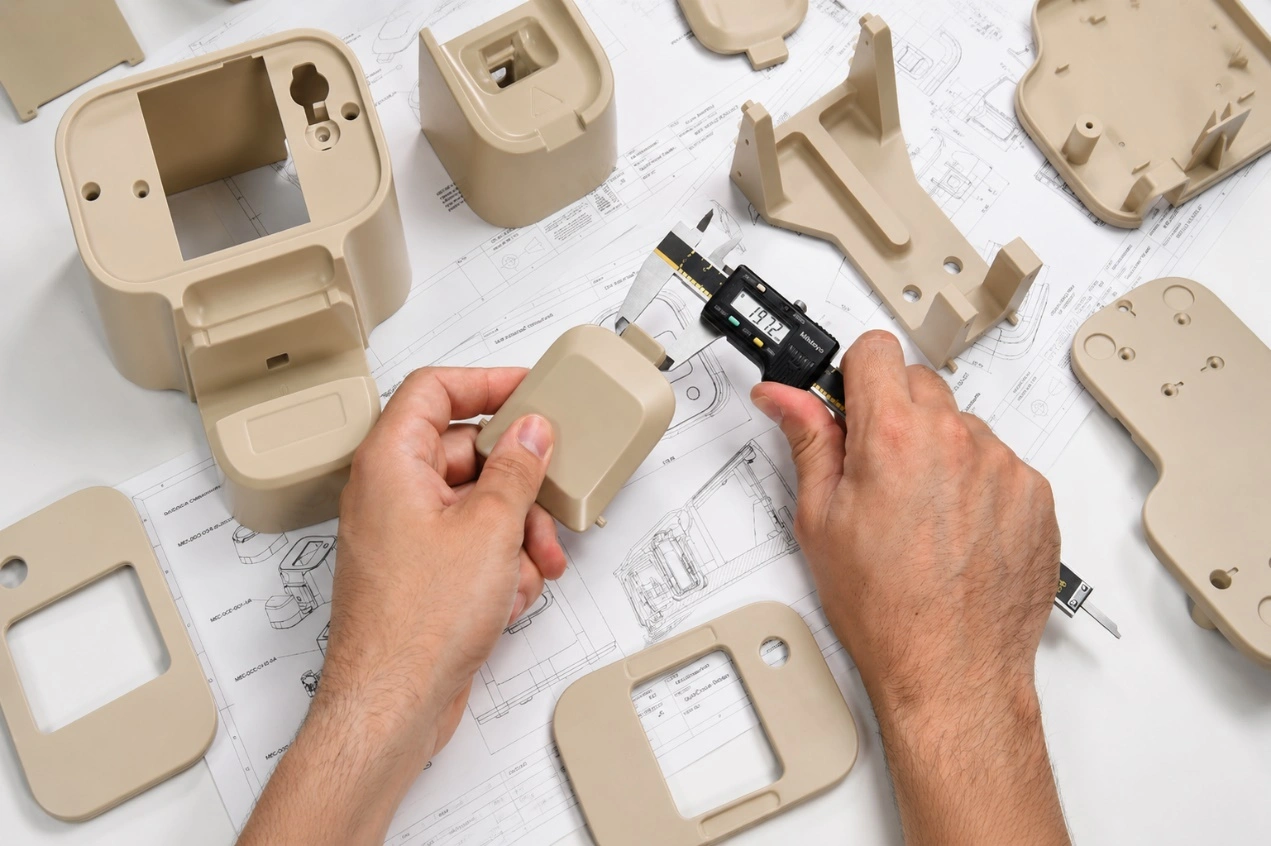
Dimensional Deviation Caused by Shrinkage Variation
Root Cause Analysis: Virgin ABS maintained a stable shrinkage rate of 0.5%. In the recycled material, molecular-chain degradation and uneven calcium carbonate filler distribution expanded the shrinkage range to 0.4%–0.9%. This eliminated a stable basis for shrinkage compensation. The mold shrinkage allowance had been calculated using the 0.5% shrinkage rate of virgin material, while the actual material shrank more, causing the overall dimensions to become undersized.
Solution: Do not use recycled modified material for precision cosmetic parts with critical dimensions. Use only virgin ABS from the original material supplier. Before calculating mold shrinkage compensation, mold standard specimens with the specified virgin resin grade, measure shrinkage in both the flow and transverse directions, and then determine the cavity machining dimensions. Establish incoming-material inspection requirements. Mold standard test specimens from every material batch and verify the shrinkage variation range.
5. Plastic Shrinkage Design Checklist for Injection-Molded Parts
The following checklist helps identify plastic shrinkage risks related to the material, product structure, and mold design;
Confirm material shrinkage before mold development: ① Verify whether the material is amorphous, semi-crystalline, or glass fiber reinforced, and review both the original supplier’s TDS and measured mass-production shrinkage data; ② Apply separate shrinkage rates in the flow and transverse directions instead of designing the mold using only an average value; ③ For precision parts, produce test specimens in advance to validate shrinkage. If the variation exceeds 0.2%, first investigate material and process stability; ④ Lock the resin grade, color code, and recycled-material ratio to prevent shrinkage drift during mass production.
Identify critical dimensions and high-precision areas: ① Clearly identify critical dimensions such as assembly holes, snap-fits, shaft locations, and mating surfaces; ② Apply independent shrinkage compensation to critical areas instead of directly using the overall average shrinkage rate; ③ Avoid localized thick sections and dense rib layouts in high-precision areas to reduce dimensional variation; ④ Reserve correction allowance for critical dimensions in the mold design to support optimization during mold trials.
Maintain uniform wall thickness: ① Keep wall-thickness variation within 20% across the main part areas where possible; ② When the wall thickness exceeds 3 mm, prioritize coring and material reduction; ③ Use smooth transitions between different wall thicknesses to avoid localized stress concentration and sink marks; ④ Avoid excessively long melt-flow paths in thin-wall areas to prevent insufficient filling and packing.
Design ribs and bosses properly: ① Keep rib thickness at approximately 40%–60% of the nominal wall thickness; ② Core out or provide relief at the roots of screw posts and locating bosses to prevent thick resin sections; ③ Arrange ribs symmetrically and uniformly wherever possible to reduce warpage caused by one-sided shrinkage; ④ Use multiple thin ribs instead of a single thick rib to balance stiffness and shrinkage deformation.
6.Summary
Plastic shrinkage is an unavoidable physical phenomenon in injection molding. It depends not only on the material type but also on the product structure, mold design, cooling system, and molding process. For general products, engineers can achieve stable dimensions through appropriate material selection and structural design. For large housings, glass fiber reinforced materials, and high-precision assembly parts, however, DFM review and Moldflow analysis should be completed early in product development to identify shrinkage risks before tooling, rather than relying on repeated mold modifications at a later stage.
When developing a new injection-molded product or resolving dimensional nonconformance, sink marks, warpage, or assembly difficulties, Holly Plastic Parts can provide DFM analysis and injection molding engineering evaluation before mold manufacturing. The team can identify potential risks in advance and recommend more manufacturable improvements based on the product structure, material characteristics, and production requirements.